Using Trendlines: trade with trends instead of being a victim to them...
Trendlines are a very basic yet powerful tool used in technical analysis (analyzing stock charts). They are used to illuminate the general direction of a stock's price movement.
Trendlines are based on the idea that a stock, or the market, moves in trends (upwards, downwards, and sideways). It can be assumed that prices will continue in the direction of the trend until the trend is broken.
Trends can be narrowed down into three time frames:
- Short Term Trend
- Intermediate Term Trend
- Long Term Trend
There is not a set time frame (days, weeks, months, etc.) that can define each of these. It depends on what charting time frame you're referring to.
A 6-month daily stock chart will have a different definition for a short, intermediate, and long term trend then a 1-month daily chart.
Probably the most important aspect is to use all three time frames to give you the overall big picture of how the stock is behaving. You'll also use all three time frames to ensure you are "swimming with the current and not against it".
Have you ever tried to paddle a boat, or swim against a river current? It's hard!
You utilize all this energy and effort, and you hardly go anywhere. Swimming against the current is not a smart thing to do unless you have a specific purpose for doing so.
Well trading "against" the direction of the trend is the same thing.
It can be done, and you can make money, but trading in the same direction of the trend is easier and it will increase your chances of making a profit.
Always look at the short, intermediate, and long term trend to ensure you are staying in sync with the general direction of the stock market.
So What are Trendlines?
Trendlines are straight lines that are drawn on a stock chart along at least two price highs or price lows.
The general rule of thumb is that it takes two points to draw the trendline and a third point confirms the validity of the line (it's taken seriously). The price highs or lows are the points.
The trendline becomes more significant (stronger) as more prices touch the line.
There are three types of trends:
- Downward Trend (Bearish)
- Upward Trend (Bullish)
- Side to Side (Channeling)
Trendlines are primarily used to manage trades and to help you see when or if the trend is changing.
Downward Trendlines...
A downward trendline is used when prices have been falling. You construct a downward trendline by drawing a straight line "down and to the right" across price highs. All price action is below the trendline:
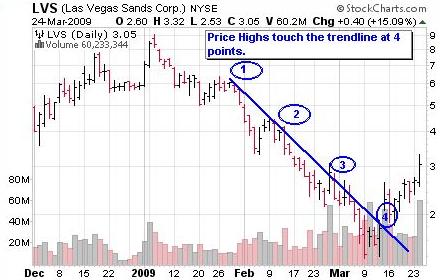
Make sure to get as many price highs to touch the line as you can, but not all points have to be exactly on the line.
As long as prices stay below the trendline, the downward trend is considered intact.
Bearish trading strategies and downward trendlines are a great compliment to each other.
Upward Trendlines...
An upward trendline is used when prices have been rising. An upward trendline is constructed by drawing a straight line "up and to the right" across price lows:
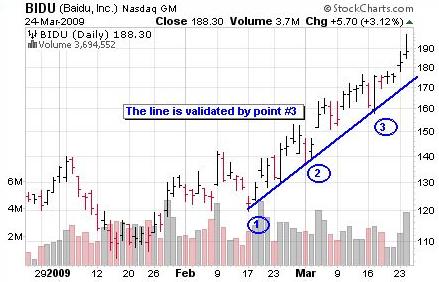
Make sure to get as many price lows to touch the line as you can, but not all points have to be exactly on the line.
As long as prices stay above the trendline the uptrend is considered intact.
Bullish trading strategies and upward trendlines are a great compliment to each other.
Side to Side Trend (a Channel)...
A side to side trend is often called a channel. It's when stock prices have been moving up and down between two parallel price barriers.
To construct the trendlines for a channel you draw a horizontal line across price highs AND across price lows. The area between these two lines is called the channel.
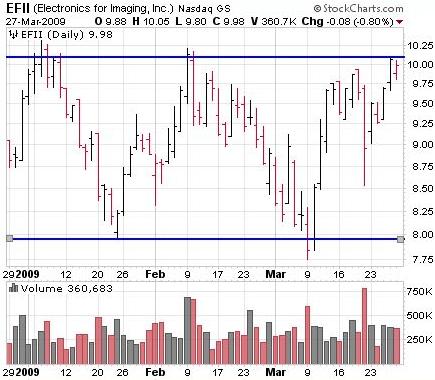
Prices are bound by the two parallel price barriers which are illuminated by the lines. The upper line is commonly referred to as the resistance level and the lower line is referred to as the support level.
Support and resistance are two concepts we will discuss in the next lesson.
Many traders make the mistake of assuming that a trend is changing just because the stock price closes outside of the trendline.
While this may be the case, there are generally three situations that can occur if the stock closes outside of the trendline:
- Prices will stay outside of the trendline for a day or two, and then drift back into their previous direction.
- Prices will break the trendline and drift in a horizontal channel for a period of time.
- Prices will break the trendline and create a new trend in the opposite direction.
Using a trendline can help you maximize profits and minimize losses. You can also use them for trade entry and exit signals.
Trading with Trendlines...
Trendlines have a number of purposes in regards to trading. They can be used to manage trades, time trade entry and exit, and as a style of trading.
The two trading styles I will focus on are...
- Trendline Breaks (aka Breakouts)
- Trendline Bounces (aka Buying on the Dip)
Trendline breaks are trend reversal trades. They occur when prices break or drift outside of the current trend and start a new trend:
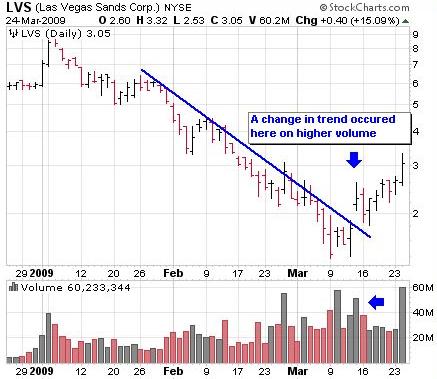
In this case prices did in fact start a new upward trend. To trade this kind of trendline break (downward trend) you would buy a call option when prices break outside of the downward trendline.
It's the opposite for an upward trendline. As an upward trendline is broken you would buy a put option.
If a stock closes outside of a trendline, always asses the volume and "how" it broke outside of the trend. In the case above there was a large gap in price action and higher volume.
Because of the gap in prices and the higher volume (aggressive movement), this would be considered an "upside breakout". The high volume and gap in prices strengthens the possibility that this is a valid trend change.
Trendline bounces are trend continuation trades. You would participate in this type of trade if you expect prices to continue in the direction of the trend.
A trendline bounce occurs when prices move (dip) toward the line, touch it, then bounces off and reverses back into their original direction:
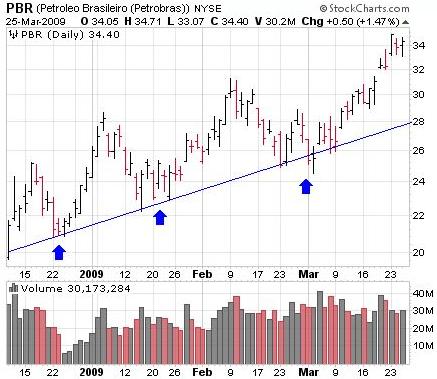
In the case above we have an upward trend. Ideally you would buy a call option when prices touch the trendline (blue arrows). After the stock bounces off the line and continues back upward, your call option will begin to gain value.
Once your call option gains enough value, you can sell it for a profit and wait for the next opportunity to "buy on the dip".
This method of trading is also suitable for stocks that are trending in a channel.
In my experience, trading purely off of trendlines is tricky, yet possible. I would advise using additional confirming indicators if you are going to employ this strategy.
It's easy looking at a stock chart in hindsight and saying, "Wow, if I would have bought here or there, I would have made a lot of money". Making money is not the problem.
The problem that arises is that in predicting the future while looking at a chart in the present can be difficult.
You see that prices have touched or broken the trendline and you essentially have to have faith that what you "think" will happen will indeed happen. You may begin to doubt yourself or become overly anxious.
Trendlines are tools and they are fairly accurate, but nothing is 100% guaranteed. With a little patience and discipline, it is possible to make money trading trendlines.
Trendlines are an important part of technical analysis and you should use them whenever you can. Keep in mind though that some charts are not trendline friendly.
If you find a chart where prices do not fit well with a trendline, then don't try to force it to work. Sometimes it can be difficult to find enough points to construct a trendline.
You'll have more profitable trades if you just let things flow naturally.
Lesson Review...
Trendlines are straight lines that are drawn on a stock chart along at least two price highs or price lows. They are used to illuminate the general direction of a stock's price movement.
There are three directions that prices can trend in:
- Up
- Down
- Or side to side
Two common methods for trading with trendlines are trendline bounces and trendline breaks.
When you're looking at a stock chart, be mindful of the short, intermediate, and long term trend. If all three are generally trending in the same direction, then you'll have a greater chance of making a profit.
Swim with the current, not against it!
In the next lesson we'll discuss another aspect of technical analysis that will aid you in better understanding stock charts: Support and Resistance.
The Passive Stock Options Trading Book Series
Discover how to achieve financial freedom in only 5 years...
Read what others have to say about the book. [Amazon affiliate link]
If You're Looking For A Reliable Lower Risk Way To Be
Profitable With Options, Try The "Buffett Strategy"...
I don't know what has brought you to my page. Maybe you are interested in options to help you reduce the risk of your other stock market holdings.
Maybe you are looking for a way to generate a little additional income for retirement. Or maybe you've just heard about options, you're not sure what they are, and you want a simple step-by-step guide to understanding them and getting started with them.
I have no idea if options are even right for you, but I do promise to show you what has worked for me and the exact steps I've taken to use them to earn additional income, protect my investments, and to experience freedom in my life.
If you want to learn more, I invite you to download a FREE video case study on how to trade options like Warren Buffett.
Inside you will discover...
- How investors pay me money to buy their stock.
- How "combining option selling with option buying" resulted in a 60% growth of my account.
- The "Family Freedom Fund" strategy I use to beat the market each year (I'm an experienced investor so your results may vary).
- And lastly, there is a high risk way to trade options and a low risk way. You'll discover a low risk "sleep well at night" method of investing.
Fill in your details below to download your FREE case study. Along with your case study, you'll also get my daily emails where I share my favorite option trading strategies, examples of the trades I'm currently in, and ways to protect your investments in any market.
Wealth Building Resources
Free Video Case Study (Newsletter)
Options Trading Made Simple Book (My Kindle book)
Options Wealth Academy (High End Training Program co-founded by Travis)
Free Options Course Learning Modules
|
Module 1: Option Basics |
Module 2: Option Value |
Module 3: Basic Strategies |
|
Module 4: Stock Charts |
Module 5: Technical Indicators |
Module 6: The 7-step process I use to trade stock options |
Learn Stock Options Trading Home Page
