Using Support and Resistance: it's a self fulfilling prophecy of price stagnation...
In simple terms, support and resistance are areas on a stock chart that act as price barriers. Using them to your advantage can maximize your trading profits.
Support and resistance are highly regarded in the world of technical analysis (analyzing stock charts).
They are so highly regarded that it's an absolute must for you to become familiar with these terms before you start trading.
With a bit of practice, you'll be able to pull up any stock chart and within seconds determine where either one of these two are.
As you will see in a moment stocks tend to stop and reverse several times at or around the same price level.
What Does Support Mean?
Support is a price level on a stock chart where historically the stock has had difficulty falling below. The price level acts as a floor and prevents the price of the stock from falling any further.
A level of Support is always found BELOW prices.
There are two ways the stock will test this level of support:
- Either the stock will fall to this level and then "bounce" off of it and begin to rise again or...
- The stock will fall to this level, break through it, and continue dropping until it finds another level of support, a resting spot so to speak.
Below is an example of how support works. The stock found support around $40. It bounced around $40 for some time and then when it finally broke the $40 threshold, it continued dropping until it found its next level of support around $29.
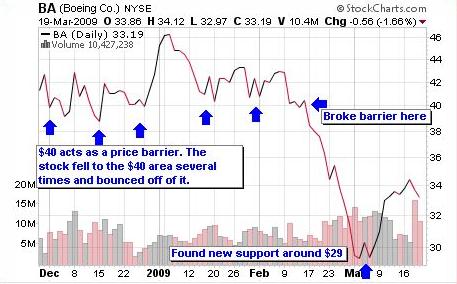
The more times a stock falls to the level of support and bounces off it, the more significant (stronger) the price level becomes.
What Does Resistance Mean?
Resistance in a sense is the opposite of support. Resistance is a price level on a chart where historically the stock has had difficulty rising above. This price level acts as a ceiling and prevents the stock from rising any further.
A level of Resistance is always found ABOVE prices.
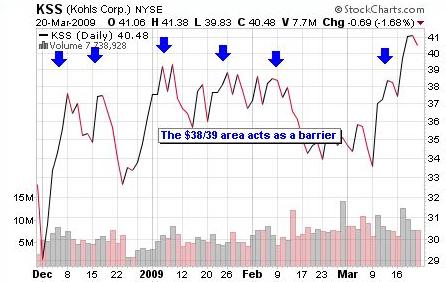
The stock price will test the resistance area in the same two ways as it does an area of support. Either it will bump up against it and reverse in the down direction, or it will break through it and continue rising.
What Causes Support and Resistance?
**The following scenarios are provided as an illustration so that you can visualize exactly how support and resistance lines are created. Although the examples are fairly accurate they cannot be attributed with being the only reason why these two lines form.**
When you first learn about support and resistance it seems almost mystical that an imaginary spot on the chart can hold prices back. Let's take a look at how they are created.
A support level is created at a point where "buying pressure" exceeds selling pressure and the decline in price is halted.
The sellers drove the price of the stock down and then the bargain hunter buyers step in and start buying the stock, which in turn causes it to reverse and start to rise again.
Those that missed out on buying the stock at a discount the first time wait for another buying opportunity. The next time the stock falls to that price level (support) they jump in and buy it to take advantage of the low price. This buying pressure causes the stock price to rise again.
If the stock falls to the support area and the sellers win out over the buyers (more selling pressure), the stock tumbles and finally breaks through the support line. Majority rules!
A resistance level is created at a point where "selling pressure" exceeds buying pressure and the rally in stock price is halted.
The stock will rise to a certain point. People who believe the stock has peaked will begin to sell, which in turn causes the stock to reverse and fall in price.
Those that decided to hold onto their stock see this kind of price action and when the stock rises to that point again they decided to sell and lock in their gains. And once again this selling pressure causes the stock to reverse and fall again.
The moment the buyers win out over the sellers (more buying pressure), the stock breaks through the resistance barrier and continues to rise higher.
Why are Support and Resistance so Important?
The price barriers are important because a large majority of investors pay attention to these two areas. Start listening to CNBC, you will hear a great deal of traders and commentators talk about support and resistance.
People pay attention because the two levels strongly influence the stock price.
In a sense, it becomes a self-fulfilling prophecy. Investors and traders tend to "remember" the previous areas that a stock has had trouble proceeding past and they "act" based on this thought.
This behavior can be seen on a stock chart and is reflected by the support and resistance levels. This gives the two levels of psychological importance because the longer it stays stuck in this area, the stronger it becomes imprinted in the investor's mind.
As an options trader you're not going to participate in this back and forth tussle between buyers and sellers. You're going to sit on the sidelines until they make up their mind. Once a definite direction in the stock price is decided, you will then step in to capitalize on the movement.
Tips and Techniques...
Certain support and resistance levels are more important than others. The significance of the level depends on the following factors:
- The number of times the level has been tested. The more it has been tested (bumped up against) the stronger it becomes in holding the stock back.
- The amount of volume that has been traded near the level, the higher the volume the more traders are participating in the move.
- Whether the level is old or new (recent levels have greater significance).
- Whether the level is a new High or new Low, more extreme levels have greater impact.
- A level formed at a round number (i.e. $40, $60, $100, etc.) leaves a lasting imprint.
Support and Resistance always run horizontally, not at an angle. It's a common practice of traders to draw horizontal lines (trendlines) on the stock chart to identify where support and resistance are.
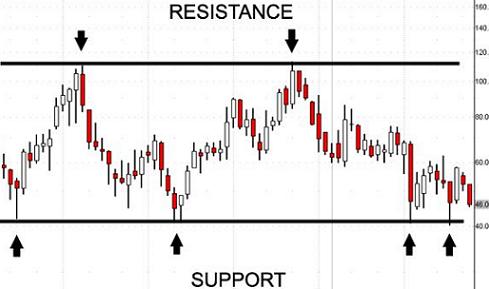
This aids you in seeing the area better. It also helps you craft your trading plan and pinpoint exactly where you will get in and out of the trade.
For example, if you're thinking of going long on a stock (buying a stock) and there is a level of resistance overhead, then you may want to wait and see if the stock will finally break through the price barrier.
If I enter a trade and the stock doesn't break that line of resistance, then I will either lose money or come out close to break-even. So it's no use tying up your money in a trade if it isn't going to perform the way you want it to.
I NEVER enter a trade until I've determined where support and resistance are.
**Keep in Mind**
Support and Resistance are NOT the trendlines that are drawn on the chart. Support and Resistance are the actual price areas on the charts that seem to be holding the stock price back.
The lines are drawn as a visual aid to assist you in seeing the price barrier. Amateur traders often use the line as the "law", when in fact it's an imaginary line drawn by the trader.
*****
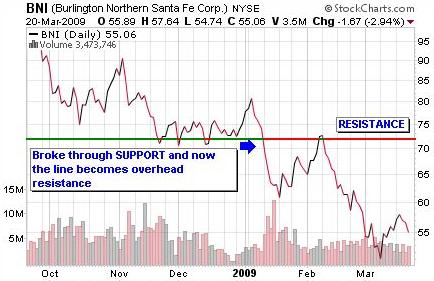
Another important point to keep in mind is that support and resistance levels reverse roles once they are broken.
Once a stock breaks through a resistance level "above" the stock, this area then becomes a support level "below" the stock.
The opposite is true for support. Once a stock breaks through a support level "below" stock prices, the area then becomes a resistance level "above" the stock price.
Lesson Review...
Support: is a price level on a stock chart where historically the stock has had difficulty falling below.
Resistance: is a price level on a chart where historically the stock has had difficulty rising above.
- As the stock price approaches a level of support or resistance it will either bump up against and reverse, or break through the price barrier.
- The trendlines that are drawn to help you see support and resistance are not the "law". It's an imaginary line drawn by the trader to help you visualize where the price barriers are.
- Support and resistance levels reverse roles once they are broken.
Before you enter a trade, evaluate where support and resistance are. They WILL affect the stock price, which in turn affects your option trade. Don't fight what the chart is telling you. Use it to help you make a profit in the market.
In the next lesson we will discuss another "tool" that will aid you in mastering the stock market Moving Averages.
The Passive Stock Options Trading Book Series
Discover how to achieve financial freedom in only 5 years...
Read what others have to say about the book. [Amazon affiliate link]
If You're Looking For A Reliable Lower Risk Way To Be
Profitable With Options, Try The "Buffett Strategy"...
I don't know what has brought you to my page. Maybe you are interested in options to help you reduce the risk of your other stock market holdings.
Maybe you are looking for a way to generate a little additional income for retirement. Or maybe you've just heard about options, you're not sure what they are, and you want a simple step-by-step guide to understanding them and getting started with them.
I have no idea if options are even right for you, but I do promise to show you what has worked for me and the exact steps I've taken to use them to earn additional income, protect my investments, and to experience freedom in my life.
If you want to learn more, I invite you to download a FREE video case study on how to trade options like Warren Buffett.
Inside you will discover...
- How investors pay me money to buy their stock.
- How "combining option selling with option buying" resulted in a 60% growth of my account.
- The "Family Freedom Fund" strategy I use to beat the market each year (I'm an experienced investor so your results may vary).
- And lastly, there is a high risk way to trade options and a low risk way. You'll discover a low risk "sleep well at night" method of investing.
Fill in your details below to download your FREE case study. Along with your case study, you'll also get my daily emails where I share my favorite option trading strategies, examples of the trades I'm currently in, and ways to protect your investments in any market.
Wealth Building Resources
Free Video Case Study (Newsletter)
Options Trading Made Simple Book (My Kindle book)
Options Wealth Academy (High End Training Program co-founded by Travis)
Free Options Course Learning Modules
|
Module 1: Option Basics |
Module 2: Option Value |
Module 3: Basic Strategies |
|
Module 4: Stock Charts |
Module 5: Technical Indicators |
Module 6: The 7-step process I use to trade stock options |
Learn Stock Options Trading Home Page
